6. Analysis across multiple samples#
6.1. custardpy_clustering_boundary#
custardpy_clustering_boundary takes the insulation level from multiple Hi-C samples (one control and multiple depletions) and categorizes TAD boundaries according to the similarity in the pattern of insulation level perturbations across the depletion samples. It is noted that the clustering is based on the perturbations in insulation (that is, the difference from the control sample) and not on the insulation level itself.
The function uses the following input data:
TAD boundary file (
--boundary, BED format)A genome_table file (
--gt)Hi-C sample directory created by
custardpy_juicercommand (where the first sample serves as the control)
custardpy_clustering_boundary [-h] [--type TYPE] [--boundary BOUNDARY]
                                 [--gt GT] [-r RESOLUTION]
                                 [--ncluster NCLUSTER] [--odir ODIR]
                                 [input [input ...]]

positional arguments:
    input                 <Input directory>:<label>

optional arguments:
    --type TYPE           normalize type (default: SCALE)
    --boundary BOUNDARY   Boundary file (BED format)
    --gt GT               Genome table
    -r RESOLUTION, --resolution RESOLUTION  resolution (default: 25000)
    --ncluster NCLUSTER   number of cluster (default: 4)
    --odir ODIR           Output directory (default: output_boundary_clustering)
6.1.1. Example#
You can use *boundaries.bed file located in the TAD/ directory, which is generated by juicer_callTAD.sh.
custardpy_clustering_boundary leverages the 500-kbp distance insulation score (BedGraph format) in InsulationScore directory generated by makeInslationScore.sh.
Both of these files are automatically created by custardpy_juicer.
custardpy_clustering_boundary \
    JuicerResults_hg38/Control:Control \
    JuicerResults_hg38/Rad21KD/:Rad21KD \
    JuicerResults_hg38/NIPBLKD/:NIPBLKD \
    JuicerResults_hg38/CTCFKD//:CTCFKD \
    JuicerResults_hg38/ESCO1KD/:ESCO1KD \
    JuicerResults_hg38/Mau2KD/:Mau2KD \
    JuicerResults_hg38/NIPBL_Rad21_KD/:NIPBL_Rad21_KD \
    JuicerResults_hg38/WAPLKD/:WAPLKD \
    JuicerResults_hg38/PDS5AKD/:PDS5AKD \
    JuicerResults_hg38/PDS5BKD/:PDS5BKD \
    --odir results_clustering_boundary \
    --boundary JuicerResults_hg38/Control/TAD/VC_SQRT/25000_blocks.boundaries.bed \
    --gt genometable.hg38.txt \
    --type VC_SQRT \
    --ncluster 6
The command will generate the following output files in the specified output directory (--odir):
Annotated_boundaries.tsv: The TAD boundaries annotated with state and cluster id.
Heatmap.diff.clustered.pdf: Heatmap of differential insulation level of all TAD boundaries with clustering, using the hierarchical clustering Ward method.
Insulation_score.chr*.pdf: Insulation score plot for each chromosome
Insulation_score.diff.chr*.pdf: Differential insulation score (i.e., differences from the control) for each chromosome.
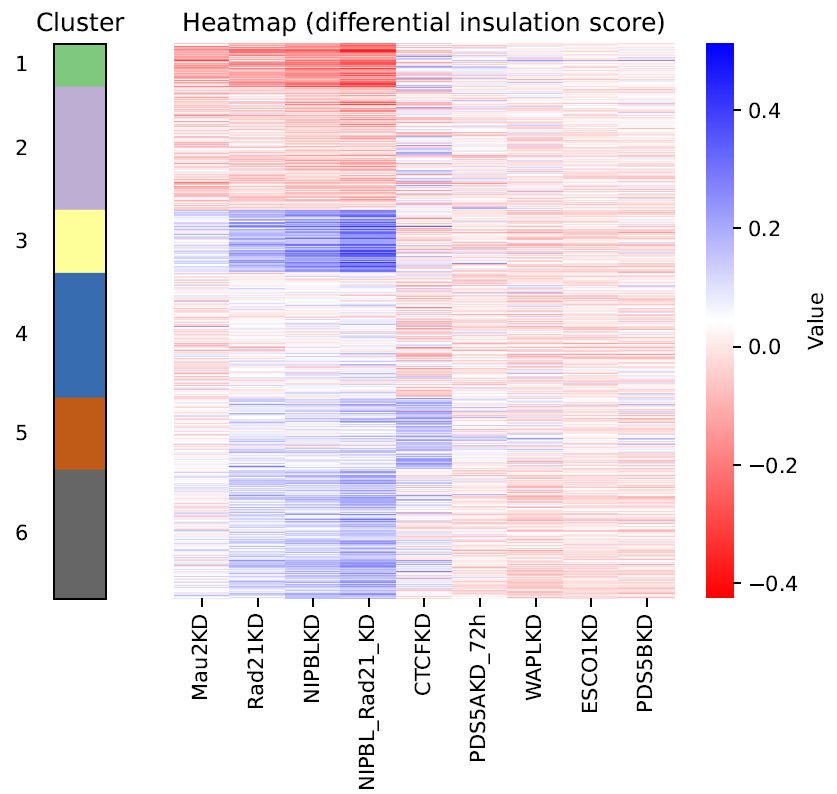
Fig. 6.1 Heatmap of differential insulation level#
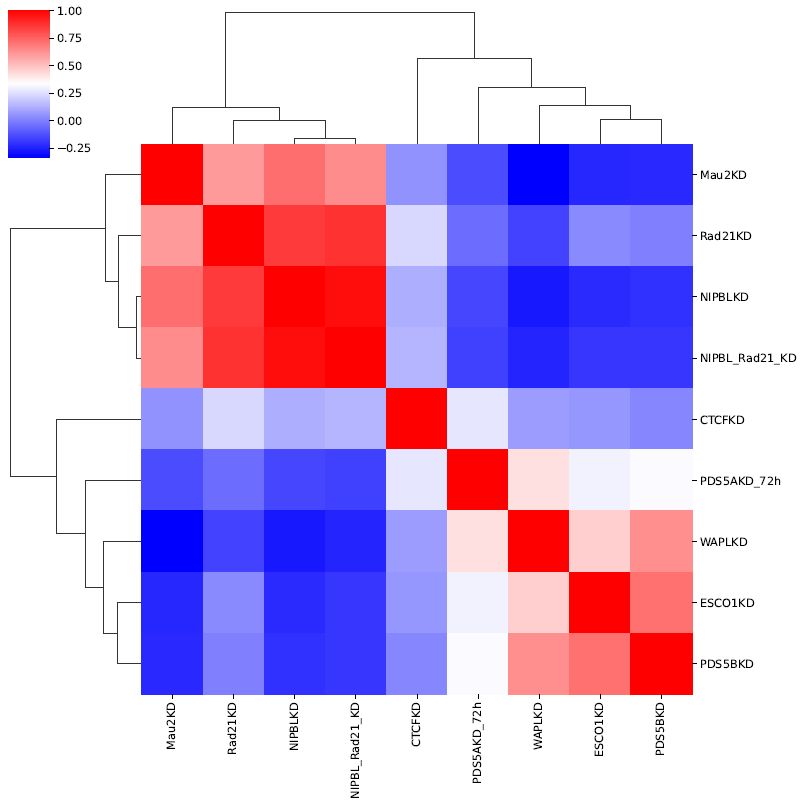
Fig. 6.2 Correlation analysis among samples#
6.2. custardpy_differential_DRF#
custardpy_differential_DRF is designed to identify “differential DRF regions” by contrasting treated and control Hi-C samples.
“Input samples” includes both treated and negative control samples.
The -c option is used to specify negative control samples from all input samples. The rest samples are considered as treated samples.
When the -c option is included, custardpy_differential_DRF identifies “differential DRF regions” where the DRF score exceeds the set threshold (--thre) and the DRF score difference between the treated and control samples surpasses the specified threshold (--thre).
In cases where the -c option is not provided, the command simply detects genomic regions where the DRF score exceeds the set threshold (--thre).
custardpy_differential_DRF [-h] [-c CONTROL] [--type TYPE] [--gt GT]
                              [--thre THRE] [-r RESOLUTION]
                              [--distance_min DISTANCE_MIN]
                              [--distance_max DISTANCE_MAX] [--odir ODIR]
                              [input [input ...]]

positional arguments:
   input                 Input sample '<Input directory>:<label>'

optional arguments:
    -c CONTROL, --control CONTROL
                            Labels of negative control samples (separated by ',')
    --type TYPE           normalize type (default: SCALE)
    --gt GT               Genome table
    --thre THRE           threshold of differential DRF (default: 0.7)
    -r RESOLUTION, --resolution RESOLUTION
                            resolution (default: 25000)
    --distance_min DISTANCE_MIN
                            minimum distance of DRF (default: 500000)
    --distance_max DISTANCE_MAX
                            maximum distance of DRF (default: 2000000)
    --odir ODIR           Output directory (default: diffDRFregions)
6.2.1. Example#
custardpy_differential_DRF --type VC_SQRT --gt genome_table.hg38.txt \
    JuicerResults_hg38/Control_1/:Control_1 \
    JuicerResults_hg38/Control_2/:Control_2 \
    JuicerResults_hg38/Control_3/:Control_3 \
    JuicerResults_hg38/Control_4/:Control_4 \
    JuicerResults_hg38/Control_5/:Control_5 \
    JuicerResults_hg38/Control_6/:Control_6 \
    JuicerResults_hg38/Rad21KD_1/:Rad21KD_1 \
    JuicerResults_hg38/Rad21KD_2/:Rad21KD_2 \
    JuicerResults_hg38/Rad21KD_3/:Rad21KD_3 \
    JuicerResults_hg38/NIPBLKD_1/:NIPBLKD_1 \
    JuicerResults_hg38/NIPBLKD_2/:NIPBLKD_2 \
    JuicerResults_hg38/NIPBLKD_2/:NIPBLKD_3 \
    JuicerResults_hg38/CTCFKD_1/:CTCFKD_1 \
    JuicerResults_hg38/CTCFKD_2/:CTCFKD_2 \
    JuicerResults_hg38/CTCFKD_2/:CTCFKD_3 \
    -c Control_2,Control_3,Control_4,Control_5,Control_6,CTCFKD_1,CTCFKD_2,CTCFKD_3
This command uses Control_1 as the benchmark for calculating the DRF score across all other samples. It’s important to note that Control_1 is thus not included when specifying negative control samples with the `-c option (samples separated by ‘,’).
The command generates the following output files in the specified output directory (--odir):
DifferentialDRFregions.thre*.tsv: The BED file containing the identified differential DRF regions
DRFdiff.chr*.thre*.pdf: Visualization of the differential DRF scores.
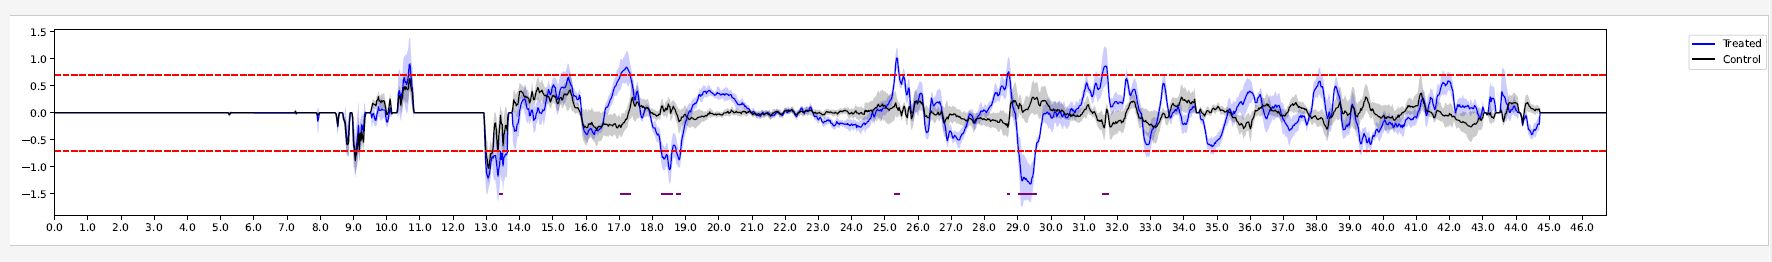
Fig. 6.3 DifferentialDRFregions (chr21)#
The graph presents the average DRF score of treated (blue line) and control (black line) samples. The dashed red lines indicates the DRF threshold (both positive and negative values). The shaded regions indicate the 99% confidence interval. The differential DRF regions identified are denoted by the purple lines at the bottom of the visualization.