5. DEG analysis#
5.1. DEG_boundary_analysis#
DEG_boundary_analysis is designed to carry out TAD-boundary proximity analysis as suggested in Ghavi-Helm et al., Nat Genet. 2019.
It utilizes a permutation test to estimate the significance of the proximity of differentially expressed genes (DEGs) or differential peaks, to the perturbed TAD boundaries resulting from protein depletion.
DEG_boundary_analysis [-h] [--border_test BORDER_TEST]
                      [--border_control BORDER_CONTROL]
                      [--gene_test GENE_TEST]
                      [--gene_control GENE_CONTROL] [-o OUTPUT] [-n N]
                      [--maxdistance MAXDISTANCE] [--step STEP]

optional arguments:
-h, --help            show this help message and exit
--border_test BORDER_TEST
                        <TAD boundary to be tested (BED format)>
--border_control BORDER_CONTROL
                        <TAD boundary as background (BED format)>
--gene_test GENE_TEST
                        <Genes to be tested (BED format)>
--gene_control GENE_CONTROL
                        <Genes as background (BED format)>
-o OUTPUT, --output OUTPUT
                        Output name (*.pdf or *.png, default: output.pdf)
-n N                  Number of permutation (default: 1000)
--maxdistance MAXDISTANCE
                        Max distance (bp, default: 300000)
--step STEP           Step of distance (bp, default: 10000)
The function requires four BED files as input data:
Test TAD boundaries (e.g., boundaries lost due to depletion)
Background TAD boundaries (i.e., all boundaries)
Test gene loci (e.g., DEGs resulting from depletion)
Background gene loci (i.e., all genes)
Using this input, DEG_boundary_analysis calculates the proportion of genes that overlap with TAD boundaries, extending the distance incrementally (--step) up to the defined maximum distance (--maxdistance).
The output data is represented graphically:
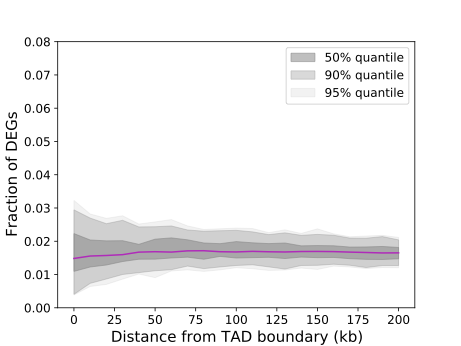
Fig. 5.1 DEG_boundary_analysis#
The purple line illustrates the observed fraction of tested DEGs against the tested boundaries. If this line deviates from the shaded region, it indicates a significant enrichment or depletion of the DEGs.